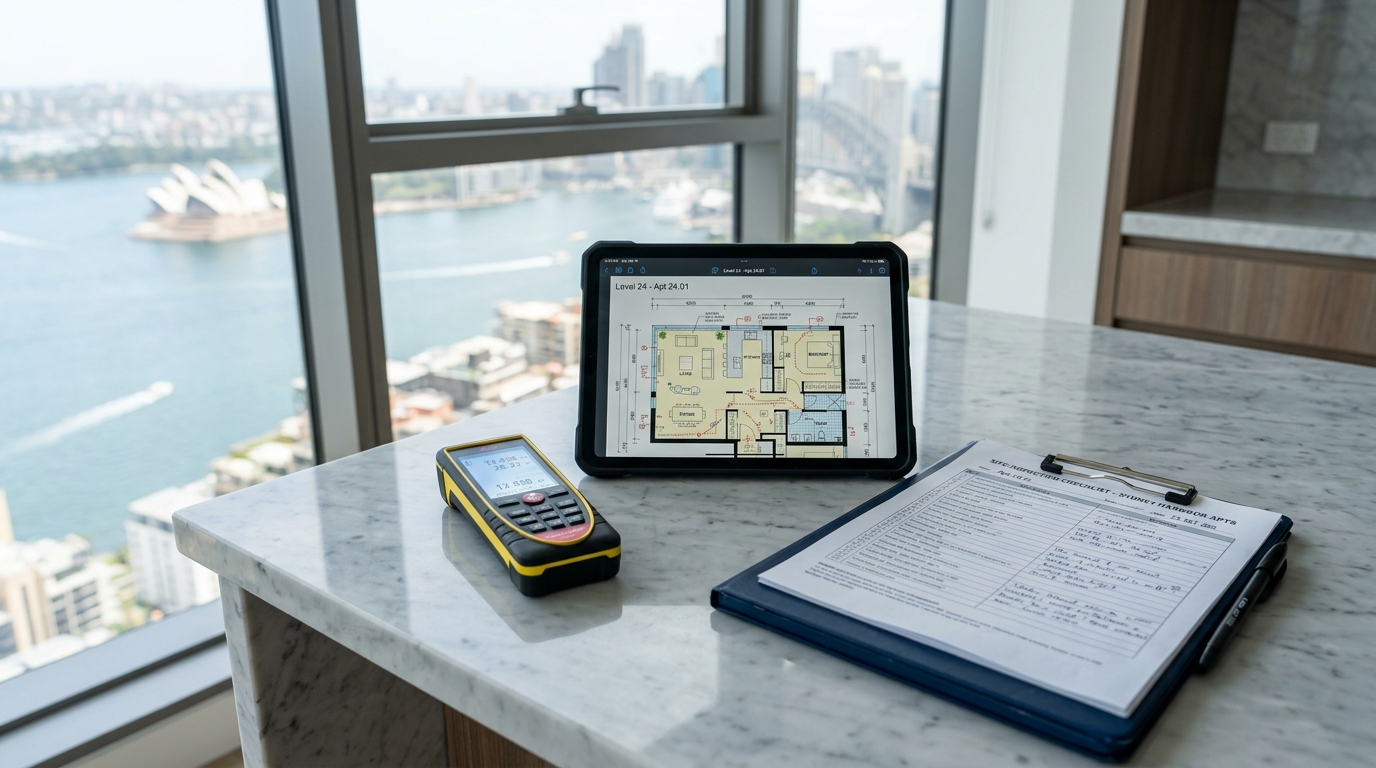
Public infrastructure investment is one of the most powerful structural catalysts for long-term property capital appreciation. In a geographically constrained global city like Sydney, transport upgrades effectively compress travel times, radically transforming commuter accessibility and unlocking localized demographic shifts.
The 3-Phase Infrastructure Capital Growth Lifecycle
Empirical property data demonstrates that capital growth resulting from major infrastructure follows a predictable three-phase trajectory:
- The Announcement & Speculation Phase: Initial government announcements generate substantial media coverage and speculative buying. However, with timelines frequently extending 8 to 12 years, inflation and construction delays often cool price growth mid-cycle.
- The Disruption Phase: During active tunneling and station civil works, localized liveability declines. Noise, traffic diversions, and street closures suppress immediate rental demand and auction sentiment.
- The Commissioning & Realization Phase: The operational launch of the asset. Daily commuters experience 15-minute time savings firsthand. High-income professionals migrate into the precinct, driving up median household incomes, rental yields, and permanent capital values.
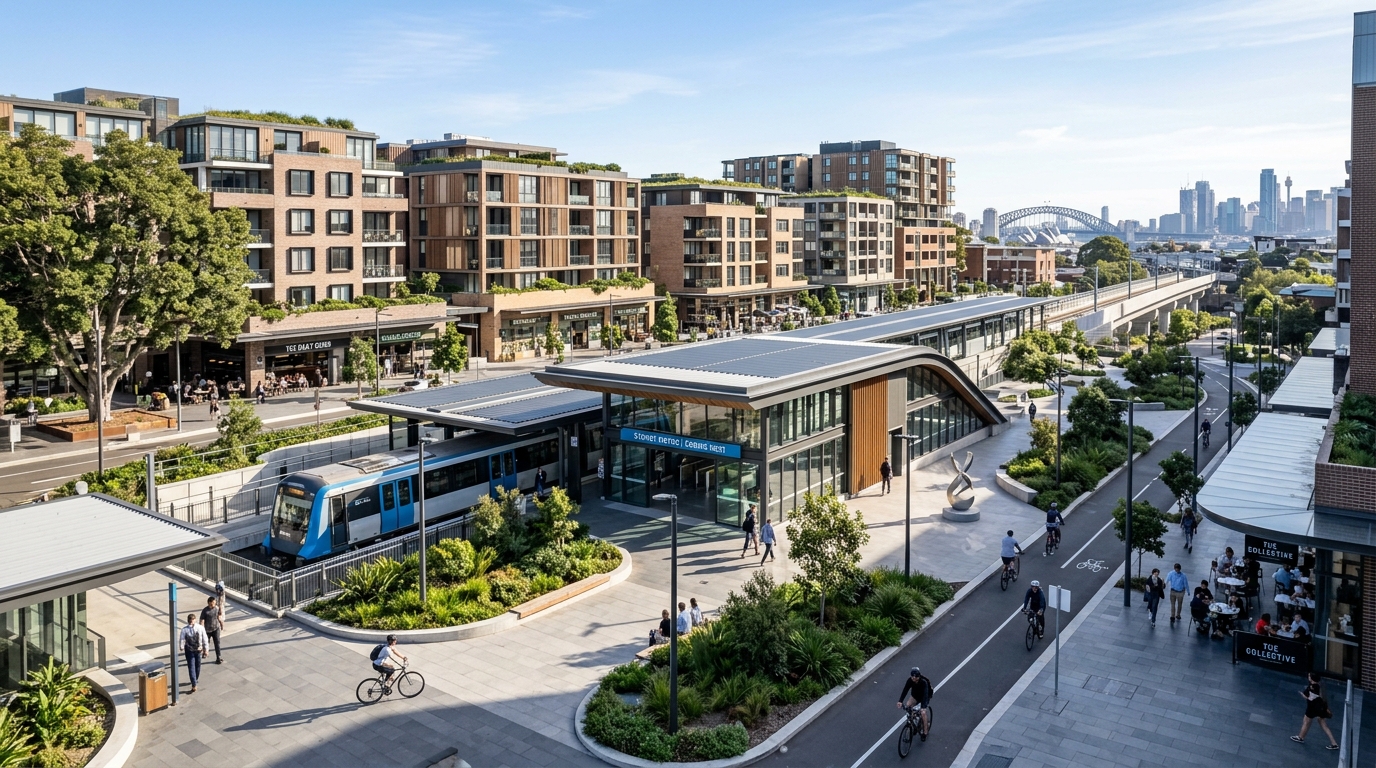
The Supply Trap: Density vs. Infrastructure
The most common error made by novice property buyers is conflating infrastructure presence with guaranteed capital growth. When state planning authorities commit billions to rail networks—such as the Sydney Metro City & Southwest or Western Sydney Airport corridors—they simultaneously rezone surrounding precincts for high-density residential towers.
If an infrastructure corridor results in the construction of 8,000 generic high-rise apartments, the resulting supply overhang suppresses capital growth for decades. The superior investment strategy is acquiring scarcity assets (established freestanding houses or boutique low-rise blocks) located 600 to 1,200 meters from the station hub—close enough to enjoy transit amenity, but protected from high-density zoning.
This dynamic ties directly into our field study on Leading Indicators of Suburb Gentrification, which details how demographic income growth drives price premiums.
Quantifying Regional Price Resiliency
Before allocating capital to emerging corridors, compare their underlying performance against historical benchmark regions. Our comparative study on Inner West vs. Lower North Shore vs. Eastern Suburbs provides 10-year empirical data on liquidity, yields, and capital growth cycles.
Explore comprehensive suburb mapping on our Suburb & Market Intelligence Hub or request an area report via our Contact Page.